Fishbone diagram (The Cause and Effect )
Characteristic and factors
Meaning of the Characteristic・・・・Result of the work
Loss product quality, product, and production volume for example
Meaning of the factors・・・・Cause impact on the results
Miss assembly, out of oil, wear for example
The purpose of the cause and effect diagram
When utilizing a team approach to problem solving, there are often many opinions as to the problem’s root cause. One way to capture these different ideas and stimulate the team’s brainstorming on root causes is the cause and effect diagram, commonly called a fishbone. The fishbone will help to visually display the many potential causes for a specific problem or effect. It is particularly useful in a group setting and for situations in which little quantitative data is available for analysis.
The fishbone has an ancillary benefit as well. Because people by nature often like to get right to determining what to do about a problem, this can help bring out a more thorough exploration of the issues behind the problem – which will lead to a more robust solution.
To construct a fishbone, start with stating the problem in the form of a question, such as “Why is the help desk’s abandon rate so high?” Framing it as a “why” question will help in brainstorming, as each root cause idea should answer the question. The team should agree on the statement of the problem and then place this question in a box at the “head” of the fishbone.
The rest of the fishbone then consists of one line drawn across the page, attached to the problem statement, and several lines, or “bones,” coming out vertically from the main line. These branches are labeled with different categories. The categories you use are up to you to decide. There are a few standard choices:
*Qutote From “http://www.isixsigma.com”
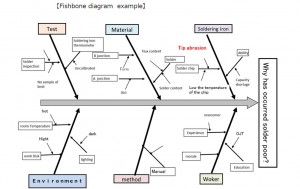
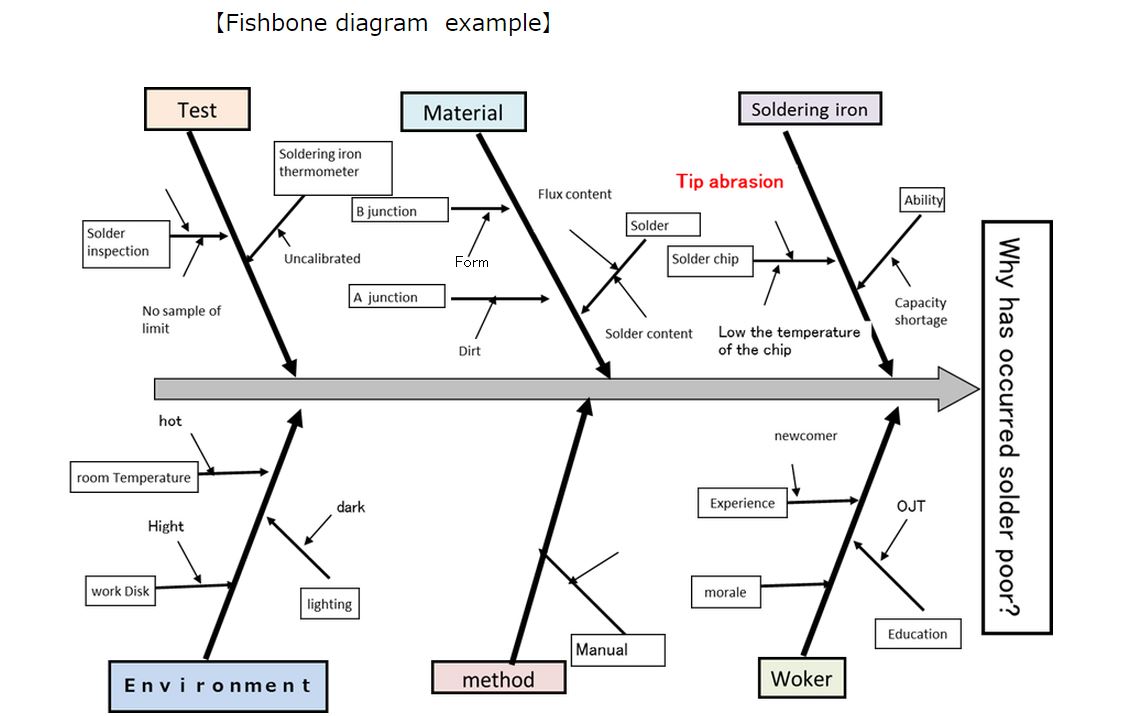
Creating fishbone diagram
1)Determine the characteristics. (problems)
For example: Why has occurred, poor solder?
Bad example: Reduce of poor solder
*Because Factors and measures same
2)Fill the large bone
Fill in the words of large bone by 5M+1E(Man ,Machine, Material,Method,measurement、Enviroment)
Man Machine Method Material measurement Enviroment
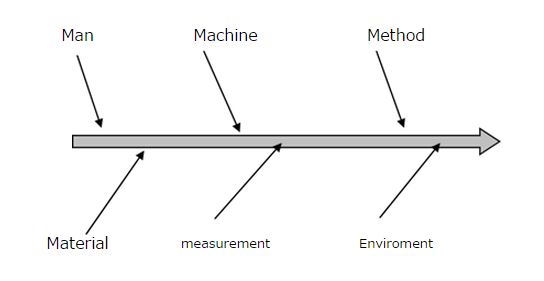
3)Fill the small bone and medium bone
4)Check the omissions
5)Mark the big factor.
6)Submit comments by using brainstorming
7)Improving
【Fish bone diagram sample Excel file 】→fish born
Form