
The purpose of the graph
Graphs have many purposes. Graph can be used to illustrate any result from data gathered. Generally, graphs present data pictorially so people can understand complicated information better. It gives a visual of easy to understand and complicated data. The bar graph also compares data by showing trends, relationships, and results of many types of questionnaires. Bar graphs are used to show information at a given point in time.
There is a purposes listed below
1)Data analysis
2)Control
3) Illustrate
4) Record
Considerations of how to make the graph
Making graph that can be understood at first sight
We do not need expensive charting software
Simple is the best
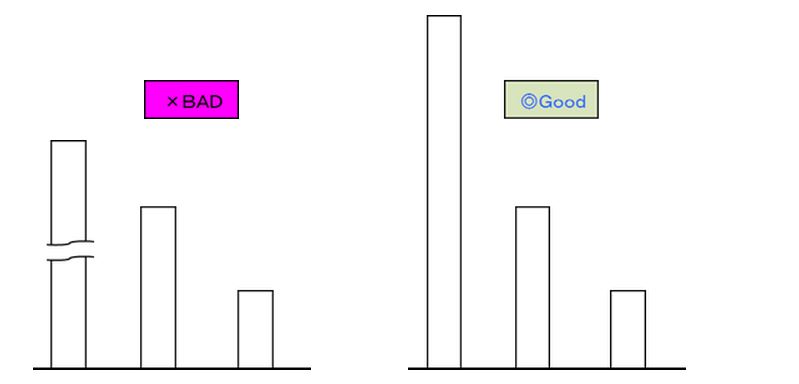
1) As possible, we will not omit the length of the stick
Because you will not be able to compare the size by eyes
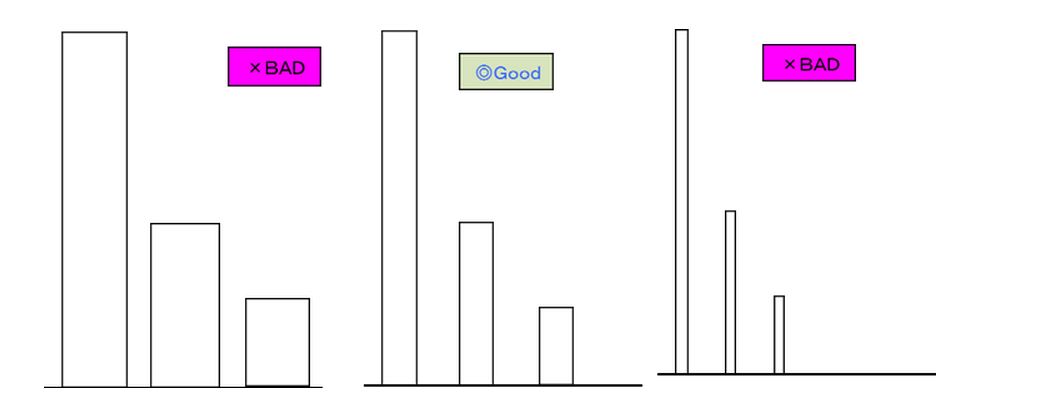
2)spacing The bar equal to the width of the bars
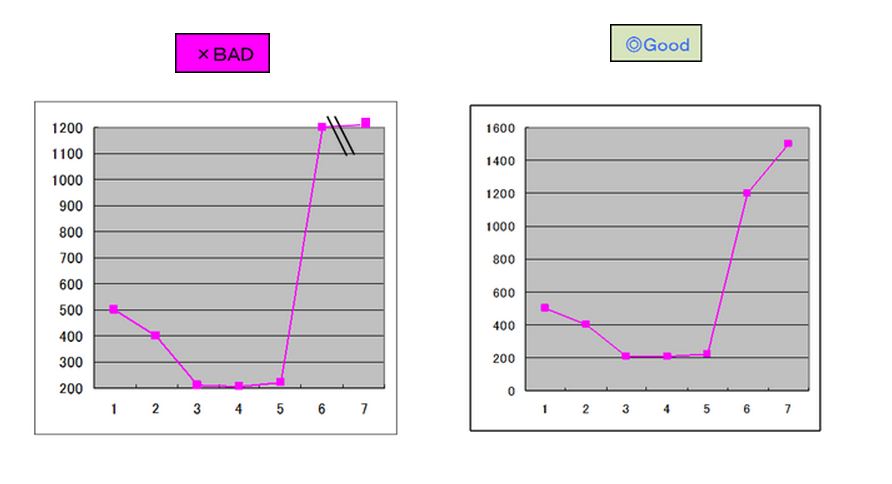
3)do not omit the scale line of graph.
Because you do not know the status of the change
4)Always Need not be the zero reference line

Becousecan understand change
5)Notes pie chart
・Start from the top of the circle
・Clockwise to the smaller number from the number that is greater
・Finally the other