What is Scatter plot?
Scatter plots show the relationship between two variables by displaying data points on a two-dimensional graph. The variable that might be considered an explanatory variable is plotted on the x axis, and the response variable is plotted on the y axis.
Scatter plots are especially useful when there is a large number of data points. They provide the following information about the relationship between two variables:
•Strength
•Shape – linear, curved, etc.
•Direction – positive or negative
•Presence of outliers
Case corresponding
1)Relationship between the results and the factors
2)Relationship between some characteristics and other characteristics
3)Relationship between Two characteristics for some results
Creating a scatter plot
Step1:
We Measure data of two Data name is X,Y
We need the data of more than 30 sets n>30
Step2:
Seek maximum value, the minimum value
Step3:
Create the horizontal axis, vertical axis.
Step4:
Plot the data
Step5:
Fill out the number of data, date and time, purpose, product name, process name, department,
and the person in charge
The point of view of the scatter plot
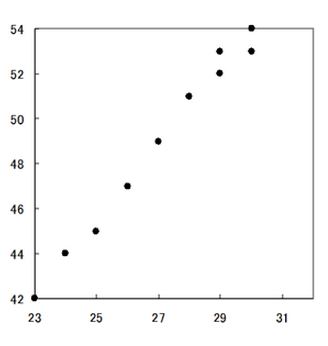
Sample Scatter Plot File→scatter plot
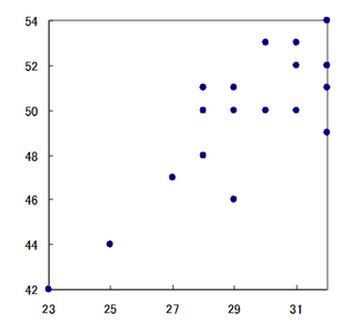
(a) Positive correlation 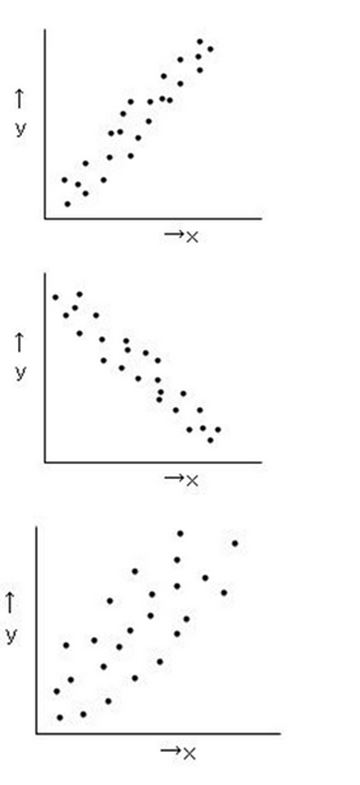
Increases x and y at the same time
Therefore Positive correlation
(b)Negative correlation
X increases Y decreases
Therefore Negative correlation
(c)Likely a Positive correlation
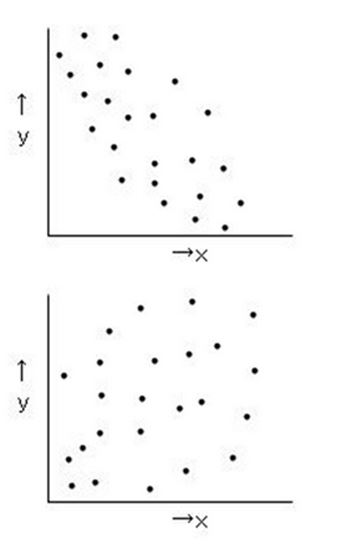
(d)Likely a Negative correlation
(e)No correlation
Notes scatter plot
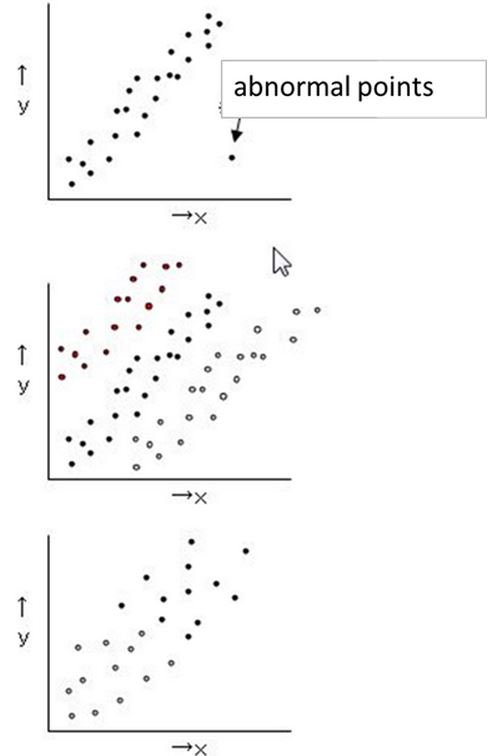
(a)Check of abnormal points
If the Cause is measurement errors and entry errorsis delete
then The Data must delete
(b)Require stratification
Correlation coefficient
In statistics, the Pearson product-moment correlation coefficient is a measure of thecorrelation (linear dependence) between two variables X and Y, giving a value between +1 and −1 inclusive. It is widely used in the sciences as a measure of the strength of linear dependence between two variables.
Formula as follows:
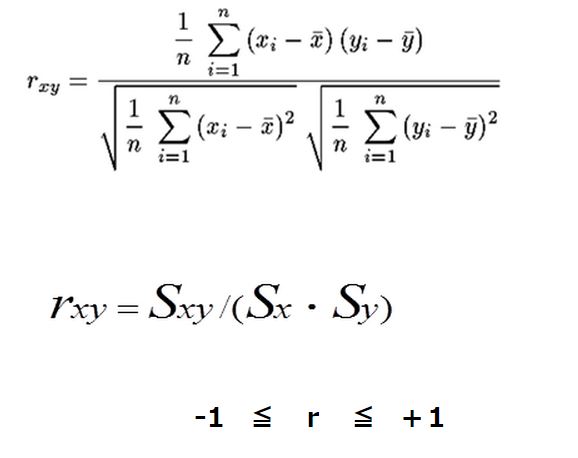
-1 ≦ r ≦ +1
The point of view of Correlation coefficient
Judgment criteria of correlation coefficient is as follows:
0.8 ≦| r | → Close correlation
0.6 ≦| r | <0.8 → Usual correlation
0.4 ≦| r | <0.6 → Not close correlation
| r |<0.4 → Not correlation
Correlation coefficient
r=0.975665 
Close correlation
 r= 0.8
Usual correlation
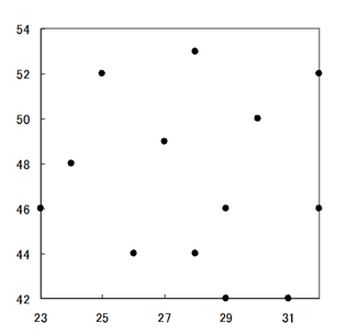
r= 0.39
Not correlation